The waste diversion rate is the percentage of material kept out of landfill or incineration through recycling, composting, reuse, or other recovery: diverted weight divided by total waste weight, times 100. It matters because it’s the clearest single number for tracking how well a site, business, or council keeps resources circulating rather than burying them, and it underpins targets set by bodies like the NSW EPA and technical guidance from the Clean Energy Regulator.
TL;DR:
- Diverted waste includes recycling, composting, reuse, and sometimes energy recovery, but definitions vary by jurisdiction and reporting standards.
- Accurate measurement relies on complete tonnage data from weighbridge tickets and processor invoices, not volumetric estimates.
- Organics can boost diversion rates by 15 to 25 percentage points quickly, especially when waste separation protocols are improved early on.
- Contamination levels, which can reject loads from processors, must be audited quarterly and deducted from diverted totals to ensure accuracy.
- Consistent, transparent accounting methodology and evidence-backed data are essential for credible diversion rate reporting, especially for external claims.
Table of Contents
- What the waste diversion rate actually measures
- How to calculate waste diversion rate: formula and worked example
- What counts as a good diversion rate by sector
- Common accounting pitfalls that distort your diversion number
- Practical strategies to raise your diversion rate
- How to measure and report diversion reliably
- Where to check the numbers yourself
- Sources
- FAQ
What the waste diversion rate actually measures
The numerator is every tonne that avoids landfill or incineration: recycling, composting, reuse, and in some jurisdictions, energy recovery. The denominator is total waste generated across the same reporting period. Get either side wrong and the headline percentage stops meaning anything comparable.
Where jurisdictions disagree is energy recovery. Some regulators count waste-to-energy as diversion because it avoids landfill; others exclude it because it still destroys the material rather than looping it back into use. Construction and demolition debris causes similar arguments, since crushed concrete used as road base counts as recovery in some accounting frameworks and as low-grade downcycling in others. The Diversion Rate toolkit from Re-Works SA treats the metric plainly as diverted weight over total weight, which is the cleanest starting definition if you’re building your own tracking system.
Practically, the rate does three jobs for an organisation:
- Sets a measurable target for waste reduction strategies and sustainability reporting.
- Feeds procurement decisions, since many tenders now require a stated diversion percentage from contractors.
- Gives regulators and investors a comparable performance indicator across sites or years.
How to calculate waste diversion rate: formula and worked example
The formula is simple: (weight of diverted waste ÷ total weight of all waste) × 100. The hard part isn’t the maths, it’s getting complete, accurate tonnage data for every stream.
- Define your reporting period (monthly, quarterly, or annual, kept consistent for comparison).
- Capture every waste stream generated in that period, not just the ones you actively manage.
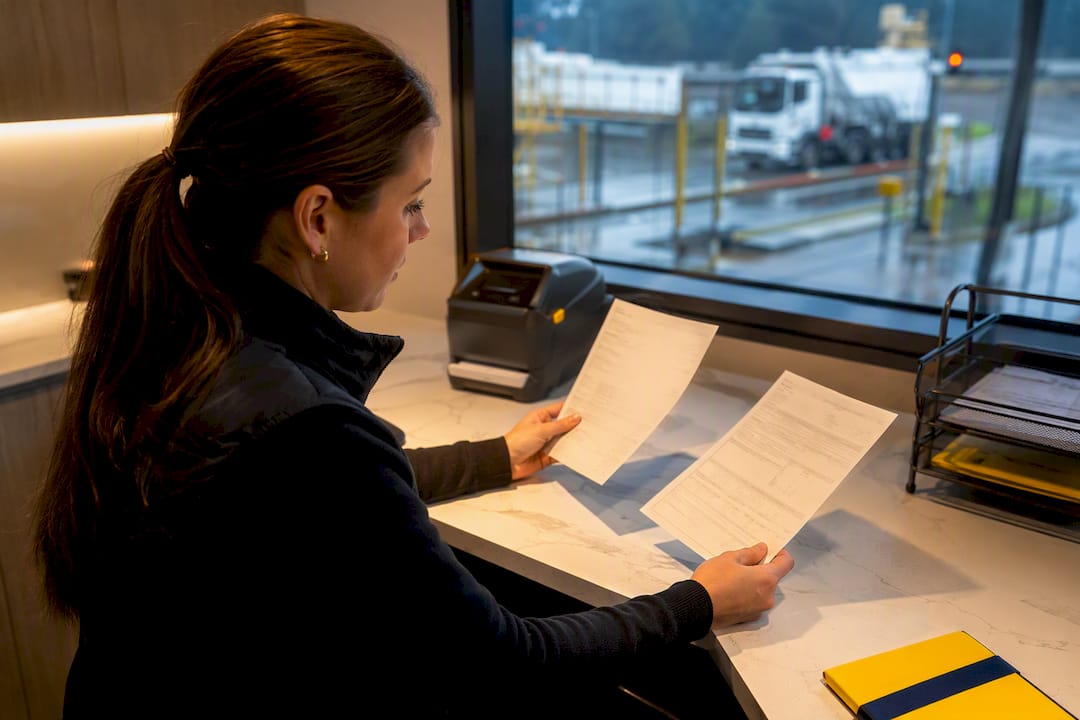
- Collect weighbridge tickets or processor invoices for each collection, since these are the preferred evidence for reporting.
- Sum diverted tonnes (recycled, composted, reused, and energy recovery if you’re including it).
- Divide by total tonnes generated and multiply by 100.
Say a commercial site generates 100 tonnes of waste in a quarter. Recycling accounts for 40 tonnes, organics collection diverts another 20 tonnes, and 5 tonnes go to reuse through a salvage program. That’s 65 tonnes diverted against 100 tonnes total.
What counts as a good diversion rate by sector
There’s no single benchmark that applies everywhere, because organics access and material mix change the ceiling. A site with no organics stream will struggle to clear around half, no matter how good its recycling sorting is, because food and green waste often make up a significant portion of total generation.
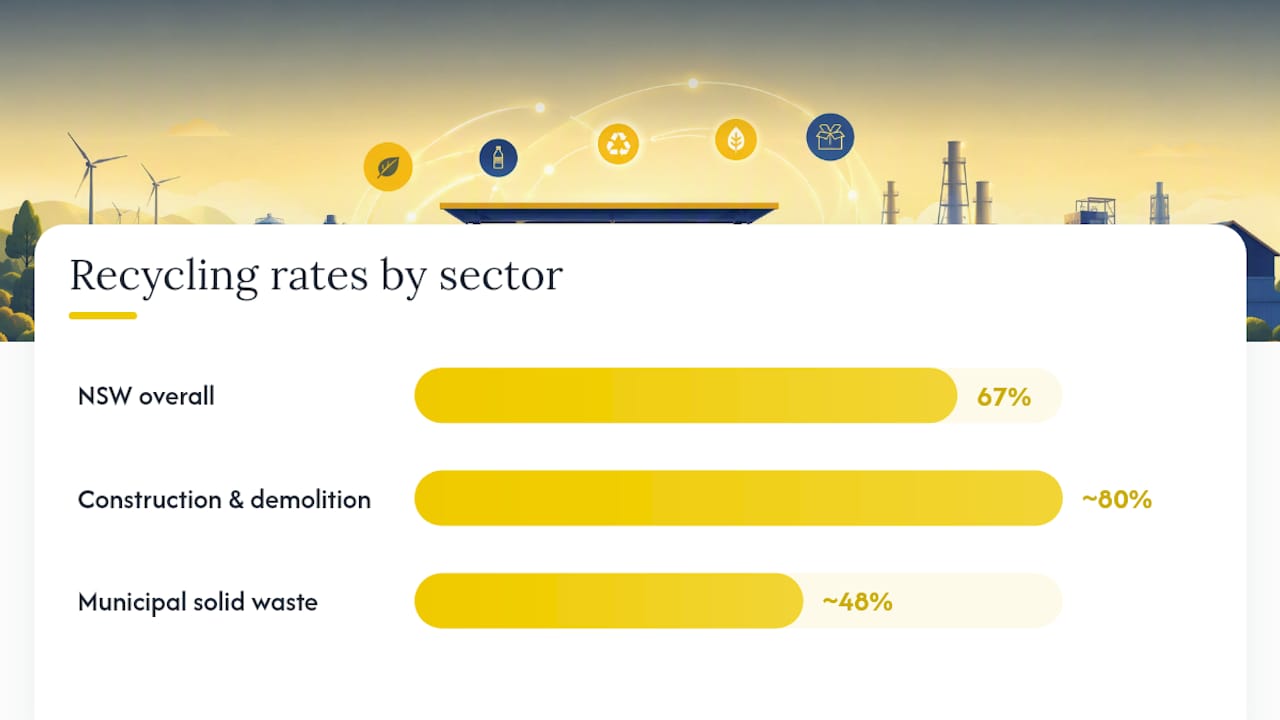
New South Wales reported an overall recycling rate of 67% in 2024–25, with construction and demolition sitting around 80% and municipal solid waste closer to 48%. That gap between sectors isn’t an accident. C&D waste is heavy, homogeneous, and easy to sort at scale (concrete, timber, metal), while household bins carry a messier mix of contaminated recyclables and unavoidable organics. National resource recovery reporting reflects the same pattern across most material categories.
Common accounting pitfalls that distort your diversion number
Denominator choice is the single biggest source of confusion. Some organisations calculate diversion against total waste generated; others calculate it against waste that would otherwise be landfill bound, excluding streams they’ve already decided not to count. The second method almost always produces a higher percentage for the same physical tonnage.
Energy recovery, self-hauled loads, and construction debris create the same problem. If your reported figure includes energy-from-waste tonnes and a competitor’s doesn’t, you’re not comparing like with like, even if both call it a “diversion rate.” Reporting methodologies can move a headline figure substantially depending on what’s counted, so always check what a benchmark actually includes before comparing your number against it.
Contamination is the quieter trap. A bin of “recyclables” that’s 20% contaminated with food waste or non-recyclable plastic doesn’t divert at face value; processors reject or downgrade contaminated loads, and that rejected material often ends up as landfill anyway.
- State clearly whether your denominator is total generation or landfill-bound waste only.
- Disclose whether energy recovery counts as diversion in your reporting.
- Run contamination audits and subtract rejected tonnage from your diverted total before calculating the percentage.
Pro Tip: Publish your accounting methodology alongside your diversion percentage. A defensible 55% with a clear methodology note beats an inflated 75% that falls apart under scrutiny.
Practical strategies to raise your diversion rate
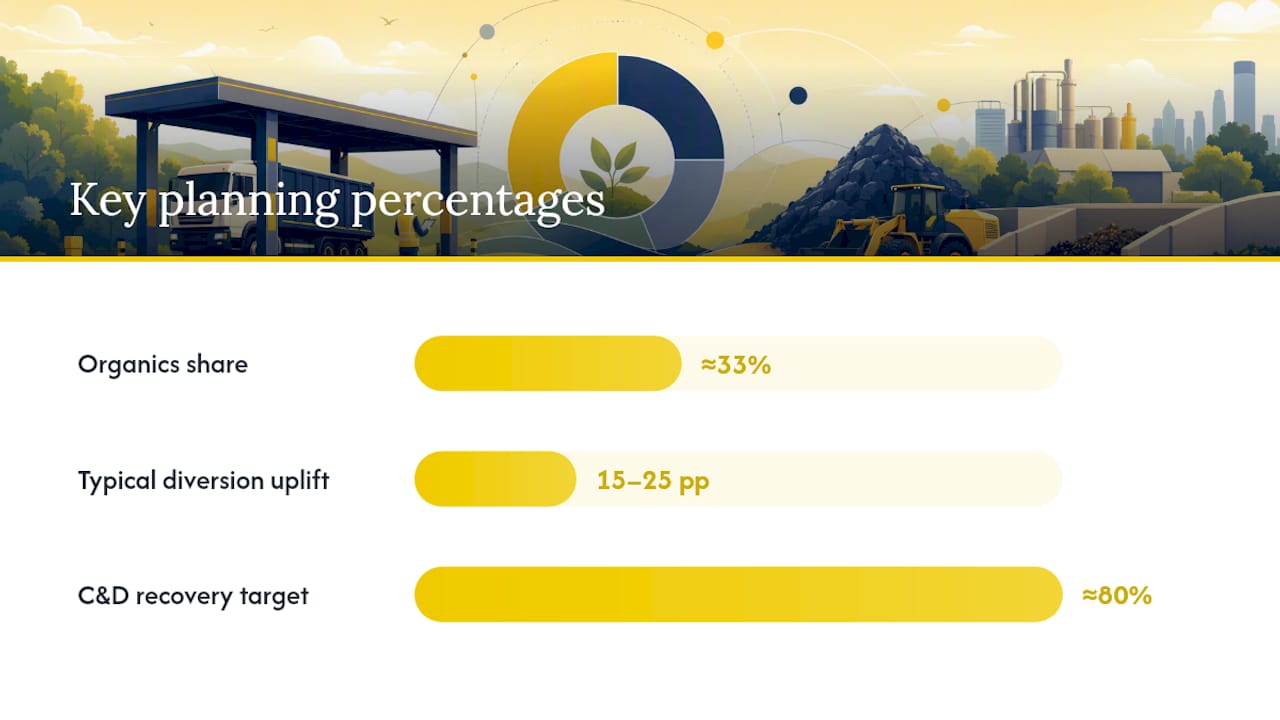
Organics is usually the fastest lever. Food and green waste can represent a third of total generation for commercial kitchens, offices with break rooms, or hospitality venues, and diverting it through composting, contracted organics collection, or anaerobic digestion often lifts overall diversion by 15 to 25 percentage points on its own, since it’s frequently the largest untapped stream.
- Capture organics first. It usually delivers the biggest single jump in diversion percentage for the least operational change.
- Fix source separation at the bin. Clear labelling, consistent bin colours, and short staff training sessions cut contamination, which protects your recycling stream from rejection.
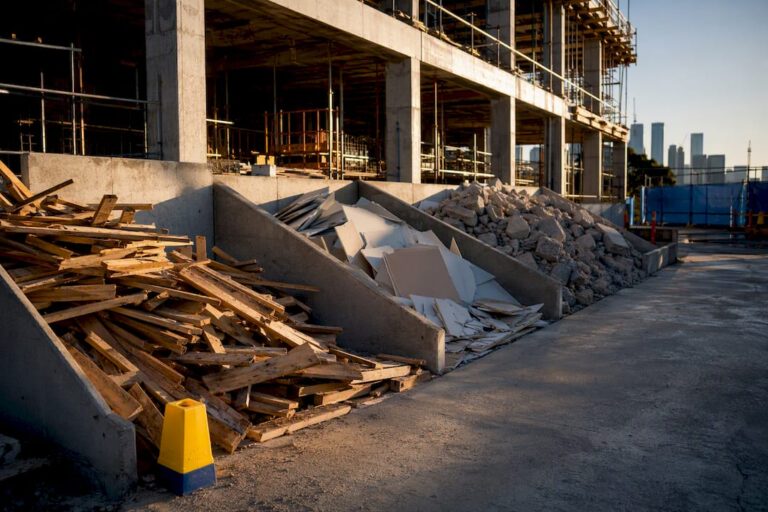
- Build a waste management plan into every construction or demolition contract. Specify salvage, deconstruction of reusable materials, and named processors before work starts, rather than sorting after the fact.
- Lock in processor contracts and quality checks. Reliable markets for your sorted material matter as much as the sorting itself. Improved sorting infrastructure means little if there’s no buyer for the recovered material, a bottleneck that circularity research from CSIRO has flagged as an ongoing constraint on recycling effectiveness generally.
| Action | Typical impact | Timeframe |
|---|---|---|
| Add organics collection or composting | Largest single uplift, often 15 to 25 points | 1 to 3 months |
| Improve bin labelling and staff training | Reduces contamination, protects existing recycling rate | 2 to 4 weeks |
| Require a waste management plan on construction jobs | Can push C&D recovery toward 80% | Per project |
| Secure processor contracts with quality checks | Prevents rejected loads reverting to landfill | Ongoing |
For construction sites specifically, a documented plan tends to outperform ad hoc sorting by a wide margin, a point backed by Western Sydney University research into sector-specific measurement and recovery challenges. If you’re managing a demolition or strip-out job, our guide to disposing of building waste in Melbourne walks through the practical side of setting that plan up, and salvage-focused contractors like Vic Sawing’s concrete cutting services can help recover material that would otherwise go straight to landfill on a demolition site.
It’s also worth remembering that a stable diversion percentage can mask rising total waste. The NSW EPA’s local government survey found recycling proportions holding steady in some council areas even as absolute tonnes recycled increased, because overall generation grew faster. Diversion improvement isn’t only about sorting better; avoiding waste in the first place matters just as much.
How to measure and report diversion reliably
Weighbridge tickets, processor invoices, and transfer dockets are the gold standard for evidence, and they’re what regulators expect when reporters estimate diverted versus disposed tonnages under Clean Energy Regulator guidance. Volumetric estimates (guessing tonnage from bin or skip volume) are common but far less reliable, since waste density varies wildly between compacted general waste and loose green waste.
Best practice among experienced operators is to reconcile every processor report against site collection records for the period, then run contamination audits at least quarterly for commercial and construction streams. Quarterly auditing catches drift in sorting quality before it compounds into a full reporting cycle.
- Keep every weighbridge ticket and invoice filed against the matching collection date.
- Reconcile processor-reported tonnage against your own site records each reporting period.
- Audit contamination at least quarterly and adjust diverted tonnage downward for rejected material.
- Consider independent verification (such as TRUE certification) once your diversion claims are being used externally, since third-party checks require documentary evidence and contamination controls that internal reporting sometimes skips.
A reported 67% jurisdictional recycling rate only holds up because it’s backed by weighbridge and processor data, not estimates. That’s the standard worth matching if your own figures are going into a tender, an investor report, or a public sustainability claim.
If your business needs a waste partner that can produce that kind of documentation on every job, Melbournecityrubbish handles commercial and residential rubbish removal across office junk, construction debris, green waste, and e-waste, with carbon-neutral disposal options available for clients who want it. Punctual collection and no mess left behind matter day to day, but for diversion reporting specifically, working with a provider that can supply consistent tonnage records makes the difference between a defensible number and a guess. Get a quick quote for your next clean-out, strip-out, or ongoing collection contract, or read about the impact poor waste management has on your business if you’re still building the case internally.
Where to check the numbers yourself
For jurisdictional figures, the NSW EPA’s waste performance data and the national resource recovery and waste materials analysis are the primary sources behind the benchmarks in this guide. For accounting method, the Clean Energy Regulator’s guideline sets out what counts as acceptable evidence. The Re-Works SA diversion toolkit is a useful plain-language reference for the formula itself, and a waste diversion rate calculator can help you run worked examples with your own tonnage figures.
Sources
- Diversion Rate — Re-Works SA toolkit
- NSW waste and recycling performance data: 2024–25 — NSW EPA
- Estimating emissions and energy from solid waste and landfill biogas management guideline — CER
- Resource recovery and waste materials analysis — Australian government
FAQ
What Are Examples Of Waste Diversion?
Recycling paper, glass, and metals; composting food or green waste; salvaging timber and fittings for reuse on construction sites; and in some jurisdictions, energy recovery from residual waste all count as diversion, provided the material avoids landfill or incineration.
Does Energy Recovery Count As Diversion?
It depends on the reporting framework. Some jurisdictions count waste-to-energy as diversion because it avoids landfill; others exclude it because the material still isn’t recycled or reused. Always check which definition a benchmark is using before comparing figures.
Why Do Diversion Rates Vary So Much Between Reports?
Different denominators (total generation versus landfill-bound waste only), inconsistent treatment of energy recovery, and contamination adjustments can all shift the same underlying tonnage into very different headline percentages.
How Often Should I Audit For Contamination?
Quarterly audits are common practice for commercial and construction waste streams, since they catch sorting quality drift early enough to correct it before it affects a full reporting period.